![]()
In this exercise you:
Add a title
Change the border for data
Move the buttons
Add a report
Move the pointer to an unused area of the form and click.
This causes the Properties view to display the form’s properties.
Type Maintain Contact Information in the Title box.
The title does not display now. When you run the form, the title displays.

Now you change the border for all data values. This improves the form’s appearance. You use lasso select to select the data.
Move the pointer near the bottom of the data and on the right.
Press and hold the left mouse button and drag diagonally to the left and up until the box (the lasso) touches all the data.

Release the mouse button.
All the objects inside the box are selected. Black boxes display in all the corners.

Select Lowered or whatever value you want from the Border drop-down list on the General page in the Properties view.
All the areas on the form used to display data values now have your selected border.

Now you move the buttons to make room for the report you are about to add.
Select a button.
You can use lasso select or click one. Small black boxes in the corners mean it is selected.
Drag the button to the top of the form.
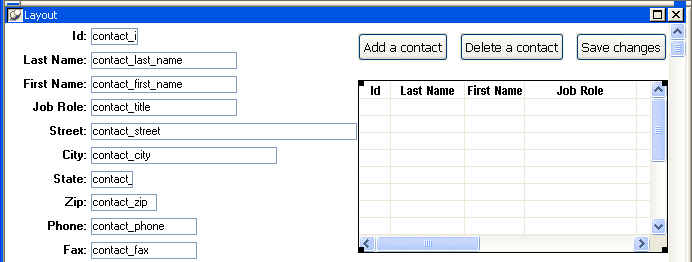
Select and drag the other two buttons until your form looks like this.

Now there is more room for the report you are about to add.
Now you add a report to provide information when you are working with the form. You can scroll in the report while you are filling out the form for a new contact. This means, for example, that you can look up an area code or zip code if it is already present for another contact.
Select Insert>Report from the menu bar.
Move the pointer into the workspace.
Your next click positions the report that you are adding to the form.
Move the pointer to the empty space on the right part of the form and click.
Four dots marking the corners of the box that will hold the report display on the form.

Now you use the Properties view to specify a few things about the report. First you are going to select the report whose contents display in the box.
Click the Browse button (the button with three dots on it) next to the DataObject field on the General page in the Properties view.
The Open dialog box displays. It lists the reports (DataWindow® objects) in tutor_im.pbl, the current library.

Scroll the list of reports, select contactgrid, and click OK.
The contactgrid report displays in the form, and its name displays in the DataObject field in the Properties view.

Next you specify that the report is to have the StyleBox border and scroll bars.
Make sure the BorderStyle selection is StyleBox.
Select the HScroll Bar, VScroll Bar and Border check boxes.

When you run the form, the report displays as a window with horizontal and vertical scroll bars. This gives you flexibility in looking at data while working on the form.
Resize the report to show more data.
To resize, move the pointer near an edge until the pointer becomes a double-pointed arrow. Then press the left mouse button, hold, and drag. Align the left edge of the report with the Add a Contact button.
When you finish resizing, the report should look something like this.
