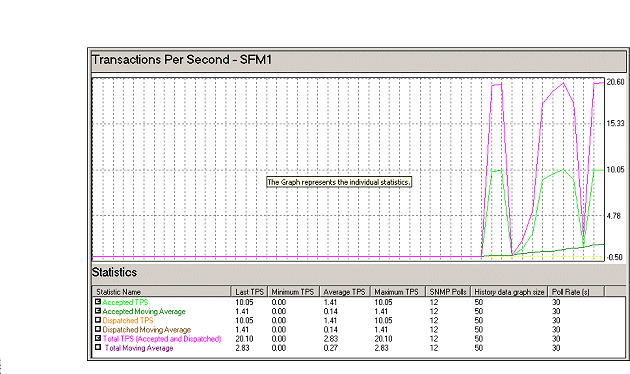

The Transaction Graph view (Figure 3-7) represents the workload for the selected SFM application. This performance information can help you plan for the best implementation of your Impact servers and to optimize and tune the servers already in place.
The Transaction Graph view provides the following static graphs as well as graphs depicting moving averages for each:
Accepted transactions
Dispatched transactions
Total TPS (SFM workload)
Figure 3-7: SFM application Transaction Graph view

An SFM, a router, and a destination offer a transaction-per-second graph that represents the workload of the specified object. Use the check boxes to display or hide graph lines for various activities.
History length is fixed at 50 polls because the agent must have a constant poll interval, which allows the TPS to function. When the agent poll interval changes, the TPS is recalibrated.
![]() You can also view a transaction graph an SFM’s
destinations. Select a destination beneath an SFM in the tree view,
then select Transaction Graph from the MMC View menu. See “Destination Transaction Graph view”.
You can also view a transaction graph an SFM’s
destinations. Select a destination beneath an SFM in the tree view,
then select Transaction Graph from the MMC View menu. See “Destination Transaction Graph view”.
| Copyright © 2005. Sybase Inc. All rights reserved. |

|
|