![]()
![]()
The Dashboard view provides displays the internal architecture of an SFM by creating a hierarchical tree that represents the relationship between the SFM’s engines, production objects, routes, and destinations.
Figure 3-8: SFM application Dashboard view
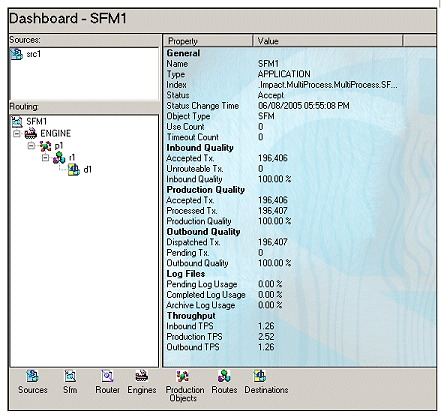
Select an object in the Sources or Routing view panes to display telemetry computations such as the percentage of unrouteable transactions, percent of cancelled transactions, percent of pending log file usage, and average input TPS.
| Copyright © 2005. Sybase Inc. All rights reserved. |
|
|
