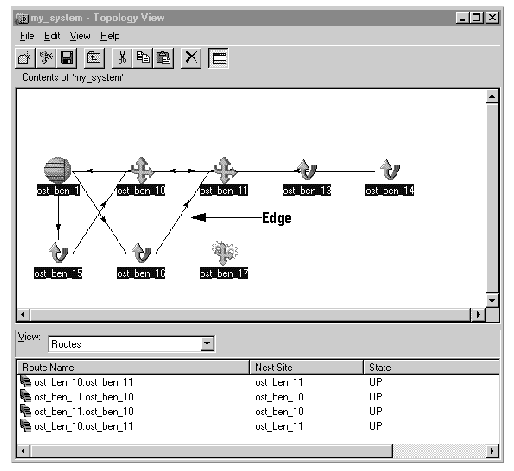
Figure 3-10 shows the topology view, which displays the relationship between server objects. Edges (lines between servers) represent database connections and routes between servers. A status grid can display a variety of information about selected replication system components.
![]() This feature is available in Replication Server plug-in
only.
This feature is available in Replication Server plug-in
only.

You can group replication system servers into any number of folders. For example, you can have a folder of all the servers at one geographical site (for example, New York City), and a folder of all Replication Servers. New York City Replication Servers would be included in both folders.
A server icon in a folder does not represent the original server object, but an alias or “shortcut” to that object. Deleting an object from the topology view or from a topology view folder simply removes it from the topology view, but does not affect the original object. You can also place folders within other folders.
![]() Folders also display in the tree view. An object may
appear several times in the tree view in different folders; however,
the folder contents are only aliases to the original object.
Folders also display in the tree view. An object may
appear several times in the tree view in different folders; however,
the folder contents are only aliases to the original object.
Edges are lines between objects, such as between Replication Servers or between data servers and Replication Servers (see Figure 3-10). Edges may represent multiple objects in the following cases:
The edge is between Replication Servers and represents bidirectional routes.
The edge is from a Replication Server to a data server and represents multiple connections.
The edge is connected to a folder and represents multiple routes and/or connections.
Status information that indicates whether a server is up, down, or suspect displays as a status icon and is associated with each folder and object. A suspect status (a question mark icon) indicates that the object is active but has some state indicating a problem, such as a replication server that is up but has an unexpected thread down. If the object is a folder, then the status indicates the worst state of the objects that the folder contains.
A status grid is included at the bottom of the topology screen. You select one or several objects, then select the system component for which you want to see status information from a list box.
For example, you could select all Replication Servers, then select routes. The status grid would display specific properties for all of the routes associated with the selected replication servers.
RSM – For detailed instructions on how to perform specific tasks, see the Replication Server plug-in help in Sybase Central.