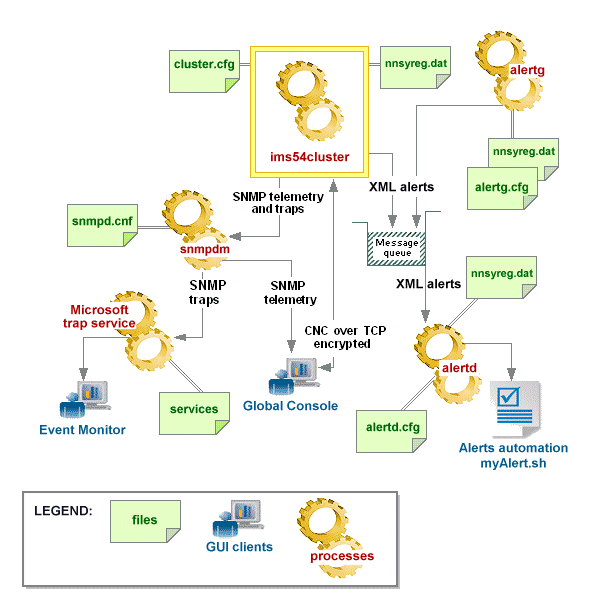

e-Biz Impact lets you monitor cluster transactions and events in real time. System administrators can use this information to identify and resolve problems, and to tune for better performance. e-Biz Impact provides monitoring at several levels, as illustrated in Figure 1-1:
Figure 1-1: e-Biz Impact monitoring overview

e-Biz Impact monitoring includes:
Global Console – displays Simple Network Management Protocol (SNMP) telemetry to a graphical user interface, which allows system administrators and operators to monitor all cluster objects on multiple e-Biz Impact servers.
Event Monitor – displays SNMP traps (messages) collected from one or more e-Biz Impact servers to a graphical user interface. Events are triggered by e-Biz Impact and provide information, warnings, or errors that occur at runtime.
Alerts – publishes SNMP traps and Open Transport XML alerts. An e-Biz Impact-provided file reads alert messages from an alert transport, such as a queue or file device, and invokes a user-maintained shell script or binary to act on the alert. Alerts provide a way for developers to respond programmatically to predefined cluster activities that require user intervention.
![]() The monitoring options on the General tab of the Cluster
Properties window in the Configurator affect what information is
made available from each cluster to the SNMP daemon. See Chapter
2, “Configuring Clusters,” in the e-Biz
Impact Configuration Guide.
The monitoring options on the General tab of the Cluster
Properties window in the Configurator affect what information is
made available from each cluster to the SNMP daemon. See Chapter
2, “Configuring Clusters,” in the e-Biz
Impact Configuration Guide.
The Global Console and Event Monitor client user interfaces are available only on Windows, but both tools monitor e-Biz Impact servers on both Windows and UNIX systems.
Alerts are invoked from a command line or terminal window and are available on both Windows and UNIX systems.
| Copyright © 2005. Sybase Inc. All rights reserved. |

|
|