![]() To open the debugger:
To open the debugger:
Do one of the following:
In the System Tree, highlight a target and select Debug from the pop-up menu
Click the Debug or Select and Debug button on the PowerBar
Select Run>Debug or Run>Select and Debug from the menu bar
The Debug button opens the debugger for the last target run in debug or test mode. The name of the current target is displayed in the Debug button tool tip. The Select and Debug button opens a dialog box that lets you select the target to be debugged.
The debugger contains several views. Each view shows a different kind of information about the current state of your application or the debugging session. Table 25-2 summarizes what each view shows and what you can do from that view.
View |
What it shows |
What you can do |
|---|---|---|
Breakpoints |
A list of breakpoints with indicators showing whether the breakpoints are currently active or inactive |
Set, enable, disable, and clear breakpoints, set a condition for a breakpoint, and show source for a breakpoint in the Source view. |
Call Stack |
The sequence of function calls leading up to the function that was executing at the time of the pause for a breakpoint, shown as the script and line number from which the function was called |
Examine the context of the application at any line in the call stack. |
Objects in Memory |
An expandable list of objects currently in memory |
View the names and memory locations of instances of each memory object, and property values of each instance. |
Source |
The full text of a script |
Go to a specific line in a script, find a string, open another script, including ancestor and descendent scripts, and manage breakpoints. |
Source Browser |
An expandable hierarchy of objects in your application |
Select any script in your application and display it in the Source view. |
Source History |
A list of the scripts that have been displayed in the Source view |
Select any script in the Source History and display it in the Source view. |
Variables |
An expandable list of all the variables in scope |
Select which kinds of variables are shown in the view, change the value of a variable, and set a breakpoint when a variable changes. |
Watch |
A list of variables you have selected to watch as the application proceeds |
Change the value of a variable, set a breakpoint when a variable changes, and add an arbitrary expression to the Watch view. |
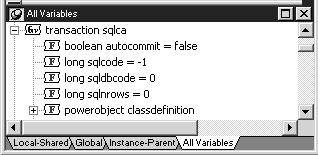
The default debugger layout contains a separate view for each variable type in a stacked pane. You can combine two or more Variables views in a single pane. For example, you might want to combine local and global variables in a single view that you keep at the top of the stacked pane.
Figure 25-1: Variables views in a stacked pane

![]() To display multiple variable types in a single
view:
To display multiple variable types in a single
view:
Display the pop-up menu for a pane that contains a Variables view you want to change.
Click the names of the variable types you want to display.
A check mark displays next to selected variable types. The pop-up menu closes each time you select a variable type or clear a check mark, so you need to reopen the menu to select an additional variable type.
When you select or clear variable types, the tab for the pane changes to show the variable types displayed on that pane.