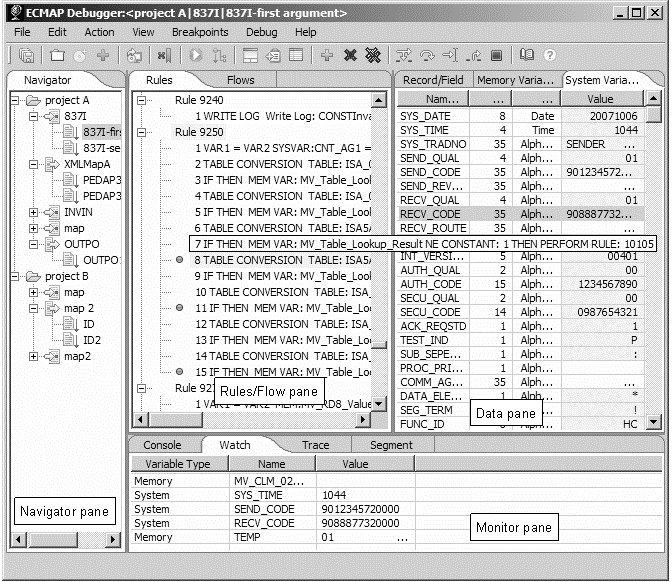
The ECMAP Debugger main window has a main menu and four panes to track data values, and control and monitor the debug process. You can also use the buttons in the toolbar to run main menu commands.
Figure 3-1: ECMAP Debugger main window

The Navigator pane in the left of the ECMAP Debugger window displays in a tree structure—the projects, map debugs sessions, and map switch sets that you create:
Projects – display as folders at the root level of the Navigator pane. Projects contain the map debug sessions that you run.
Map debug sessions – display as icons indented one level inside project folders. An inbound map debug session icon has an arrow coming in from the left and an outbound map debug session icon has an arrow going out to the right. Map debug sessions correspond to maps you create in ECMAP and can contain multiple sets of map switches that you can debug.
Map switch sets – display as document icons with a down arrow. Each map switch set contains the map arguments that you debug in each map debug session.
The title bar displays the names of the current project, map debug session, and map switch set loaded into ECMAP Debugger.
The Rules/Flow pane in the center of the ECMAP Debugger window and to the right of the Navigator pane, displays the rules, commands, and flow of the map you debug:
Rules tab – the map rules display in the Rules tab. You can see the rules listed with a “+” beside each rule, which you can double-click to display the commands that belong to the rule. Rule descriptions do not display.
Commands display in the Rules tab under the rules the commands belong to.
When you set breakpoints in the map debug session, a blue dot displays to the left of the rule or command where an individual breakpoint is set. When you clear the breakpoint, the blue dot is removed.
When you run a debug session, you can follow the progress of the map run, as the specific command that ECMAP Debugger is executing is highlighted in yellow.
Flow tab – the map flow displays in the Flow tab.
When you run a debug session, you can follow the progress of the map run through the map flow, as the specific flow level that ECMAP Debugger is processing at any moment, is highlighted in yellow.
Flow properties – the properties of the current flow level or the flow level that you select in the Flow tab, display at the bottom of the Flow tab. You can view the properties of inbound or outbound map flows. See Chapter 15, “Creating a Map Flow” in the ECMAP User Guide for more information.
Inbound:
Current Level
Segment
Before Rule
After Rule
Next Level
Outbound:
Current Level
I/O Rule
Before Rule
After Rule
Next Level
Break Level
The Data pane is the upper-right pane of the ECMAP Debugger window. When you load a map into ECMAP Debugger, map data displays in the three tabs of the pane:
Record/Field tab – lists records and fields within each record. Expand the record names to display the fields within the record and the name, length, datatype, and value of each field.
Memory Variable tab – lists the name, length, datatype, and real-time value of each memory variable in tabular form.
System Variable tab – lists the name, length, datatype, and real-time value of each system variable in tabular form.
You can select multiple system variables, memory variables, records and fields, and add the items you select to the Watch tab of the Monitor pane to display their real-time values during a debug session.
The Monitor pane is the lower right pane at the bottom of the ECMAP Debugger window. The Monitor pane displays messages generated when you perform any action in ECMAP Debugger, messages generated during a debug session, and real-time values of variables during a debug session. The Monitor pane has these tabs:
Console tab – displays the different types of messages generated during a debug session:
Debug information – debug session operational messages, such as when and where a breakpoint has been set, or when you add a memory variable to the Watch tab.
Debug error messages – debug session error messages, such as when the ECRTP library does not load successfully.
Runtime information – runtime trace messages, such as when ECRTP starts, pauses, and exits, or when a command with a breakpoint set on it executes successfully.
Runtime error messages – runtime error messages, such as when ECRTP encounters an error.
Watch tab – displays the real-time values of system variables, memory variables, and records/fields as the debug session progresses, in tabular form. The Watch tab table has columns for name, datatype, length, and real-time value.
You can select single or multiple system variables, memory variables, and records/fields from the tabs in the Data pane to add to the Watch tab for monitoring.
Trace tab – displays the trace file that generates during any map run. The trace file in ECMAP Debugger displays messages related to the debug session, such as when breaks have occurred during map execution.
Segment tab – displays the current segment information during any map run:
Map Name – the name of the map you are debugging.
File Path – the full path and file name of the map file. This map file is the input EDI file for inbound maps and the output EDI file for outbound maps. Nothing displays for an any-to-any map run as there is no output EDI file generated.
Segment Location – the position in the map file of the current segment. Nothing displays for an any-to-any map run as there is no output EDI file generated.
Segment Value – the value of the current segment that is being processed. Nothing displays for an any-to-any map run as there is no output EDI file generated.