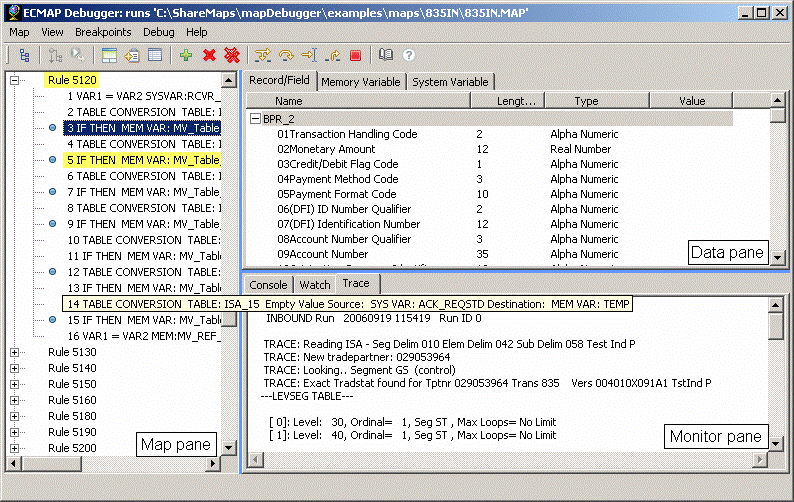
The ECMAP Debugger main window has a menu at the top for commands and three panes to track data values, and control and monitor the debug process.
Figure 3-1: ECMAP Debugger main window

The Map pane is the left pane of the ECMAP Debugger window. When a map is loaded into the ECMAP Debugger, the rules and commands that make up the map display in the Map pane.
The rules are listed with a “+” beside each rule, which you can double-click to display the commands that belong to the rule.
The command description displays with each command. Rule descriptions do not display.
When you set breakpoints in the map, a blue dot displays to the left of the rule or command where an individual breakpoint is set. The blue dot is removed when the breakpoint is cleared.
When you run a debug session, you can follow the progress of the map run, as the command that is being executed currently is highlighted in yellow.
The Data pane is the upper right pane of the ECMAP Debugger window. When a map is loaded into the ECMAP Debugger, data displays in the three tabs of the pane:
System Variable tab – lists the name, length, datatype and real-time value of each system variable in tabular form.
Memory Variable tab – lists the name, length, datatype and real-time value of each memory variable in tabular form.
Record/Field tab – lists records and fields within each record. Expand the record names to display the fields within the record and the name, length, datatype and value of each field.
You can select single or multiple system variables, memory variables, and records/fields and add the items you select to the Watch tab of the Monitor pane to display their real-time values during a debug session.
The Monitor pane is the lower right pane of the ECMAP Debugger window. The Monitor pane displays messages generated when you perform any action in the ECMAP Debugger, messages generated during a debug session, and real-time values of variables during a debug session. The Monitor pane has three tabs:
Console tab – displays the different types of messages generated during a debug session:
Debug information – debug session operational messages, such as informing users when and where a breakpoint has been set or when a memory variable has been added to the Watch tab.
Debug error messages – debug session error messages, such as if the ECRTP library is not loaded successfully.
Runtime information – runtime trace messages, such as when ECRTP starts, pauses, and exits, or when a command with a breakpoint set on it executes successfully.
Runtime error messages – runtime error messages, such as if ECRTP has encountered an error.
Watch tab – displays the real-time values of system variables, memory variables, and records/fields as the debug session progresses, in tabular form. The Watch tab table has columns for name, datatype, length, and real-time value.
You can select single or multiple system variables, memory variables, and records/fields from the tabs in the Data pane to add to the Watch tab for monitoring.
Trace tab – displays the trace file generated during any map run. The trace file in ECMAP Debugger has been enhanced to display messages related to the debug session, such as when breaks have occurred during map execution.