Throughout the development cycle, you will use Web Application Development tooling to debug your Web pages. You can debug code by setting breakpoints on the Web page or in Java managed beans by setting breakpoints in the Java class.
Before you can perform the debugging tutorials, you must complete all the previous tutorials in the guide.
![]() Setting breakpoints and launching the Debug perspective
Setting breakpoints and launching the Debug perspective
Before you begin the debugging process, be sure that the Tomcat server is stopped.
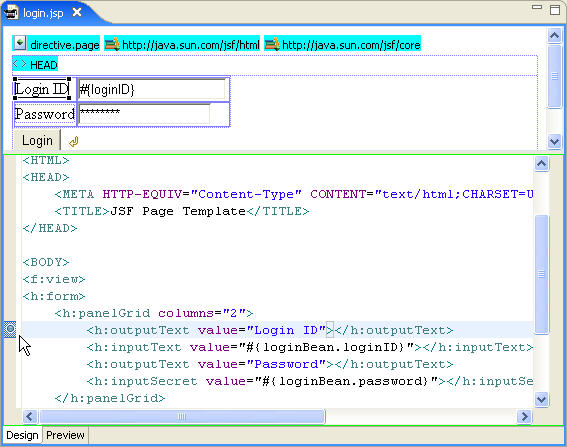
In the WorkSpace Navigator, double-click the login.jsp file to open the file in the Web Page editor.
To set a breakpoint in the Web Page editor, double-click in the vertical gray border to the left of the line following the <h:panelGrid> tag:
<h:outputText value="Login ID"></h:outputText>
A blue dot in the gray border indicates that you successfully set the breakpoint.

Next, set a breakpoint in the loginBean.
In the Data Bindings view, right-click loginBean and select Open from the context menu.
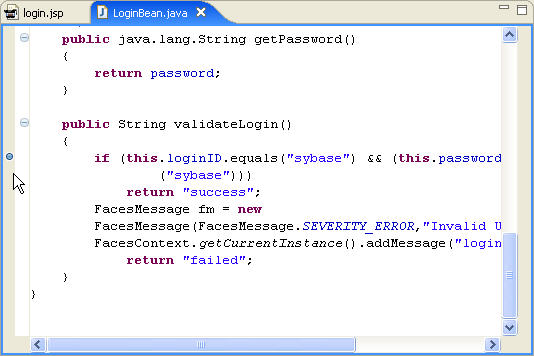
In the source view of the Web Page editor, set a breakpoint by double-clicking in the gray border to the left of the line following the if statement inside the validateLogin() method.
if (this.loginID.equals("sybase") && (this.password.equals("sybase")))
A blue dot appears in the gray border identifying the breakpoint.

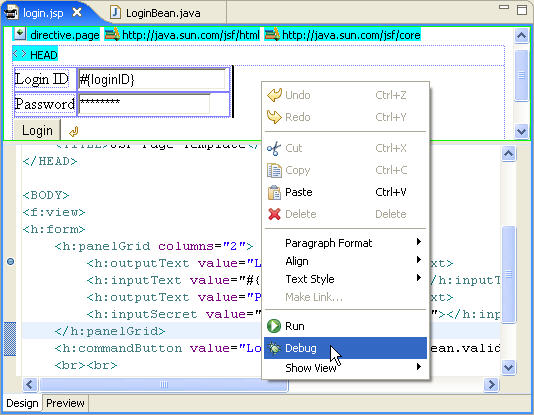
Return to login.jsp page, right-click the design pane, and select Debug from the context menu to debug the Web page.

In the Debug on Server wizard, select Choose an existing server, select Tomcat v5.0Server @ localhost, and click Finish.
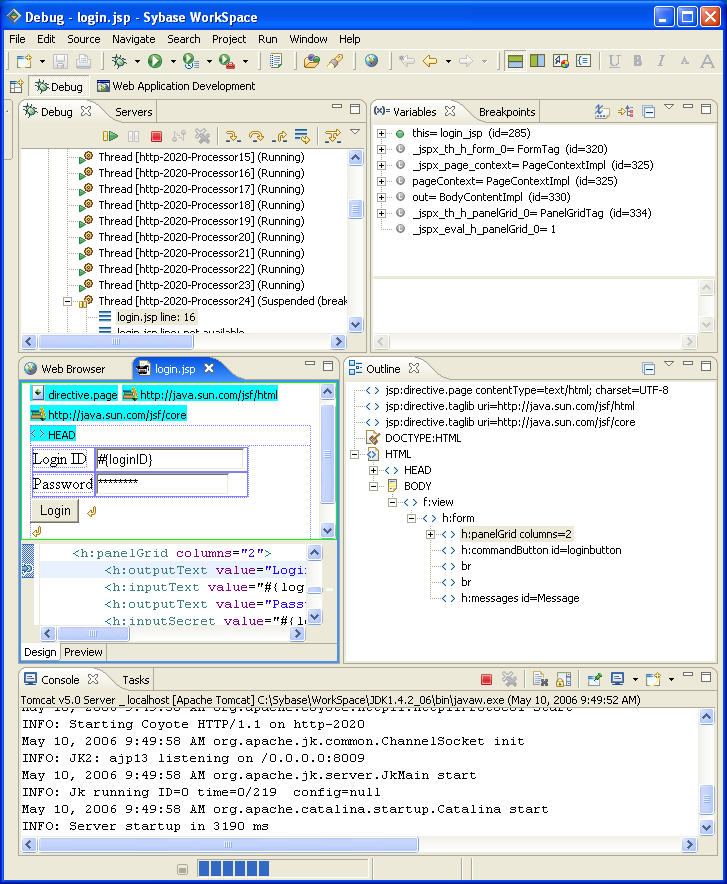
The Confirm Perspective Switch dialog box displays, which confirms that you want to change to the Debug perspective.

Click Yes to open the Debug perspective.

In the Debug perspective, you can run through the breakpoints and perform debugging tasks for your Web applications. You have now completed the Web Application Development component tutorial.