![]()
![]()
In this lesson, you will debug a stored procedure in a database.
If the Database Development perspective is already open, skip to step 2.
If the Database Development perspective is not open, select Window|Open Perspective|Database Development from the main menu bar.
If a connection to the MySybStore database is already established, skip to step 3.
If a connection is not established, right-click the MySybStore connection profile in the Database Explorer view, and choose Connect from the context menu.
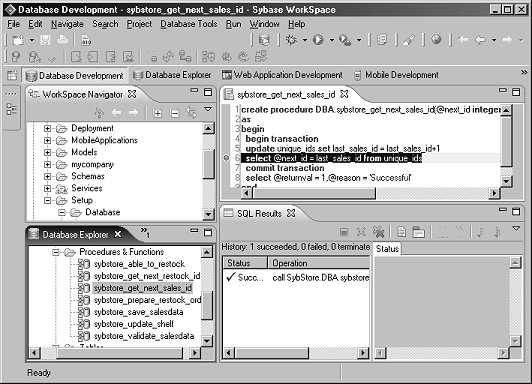
In the Database Explorer view, expand the MySybStore database connection profile, then expand the MySybStore/Procedures & Functions folder.
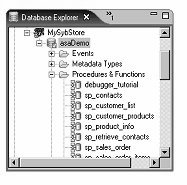
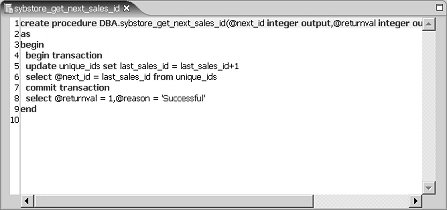
Double-click the sybstore_get_next_sales_id stored procedure. Sybase WorkSpace displays the stored procedure code in the SQL editor.
![]() If you are prompted that this action requires the Database Development perspective,
click OK.
If you are prompted that this action requires the Database Development perspective,
click OK.
The first task in debugging a stored procedure is to set a breakpoint. When a breakpoint is enabled, it suspends execution of a program thread at the location in the code where the breakpoint is set.
To set a breakpoint, find this line in the stored procedure:
select @next_id = last_sales_id
from unique_ids
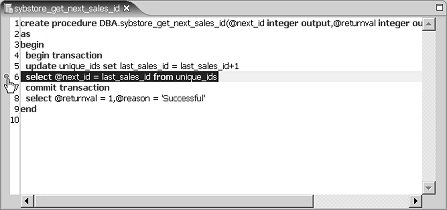
Double-click the line number to set a breakpoint. When a breakpoint is set, a small blue dot displays to the left of the line number at the location of the breakpoint.
![]() You can also set a breakpoint by placing the cursor
at the beginning of the line and selecting Run|Toggle
Line Breakpoint from the Sybase WorkSpace main menu
bar.
You can also set a breakpoint by placing the cursor
at the beginning of the line and selecting Run|Toggle
Line Breakpoint from the Sybase WorkSpace main menu
bar.
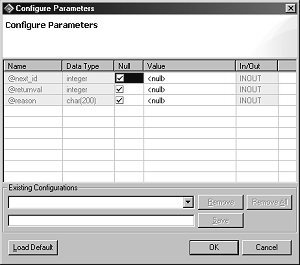
Right-click in the editor and select Run.
The Configure Parameters dialog box opens, which displays default values if they are used in the stored procedure definition. The dialog box also displays parameter values entered from any previous executions.
All parameters have null values, therefore, you are not required to enter any values.
Click OK. The SQL Results view displays the outcome of the script’s execution.
Use either of these methods to launch a debug session:
In the SQL editor, right-click and select Debug from the context menu; or
In the Database Explorer view, right-click the stored procedure name and select Debug Procedure from the context menu.
When the Configuration Parameters dialog box opens, click OK.
When an information dialog box confirms switching to the Database Debug perspective, click Yes.
The debug execution stops at the breakpoint you set, and current context information, such as variables, breakpoints, and referenced tables, displays.
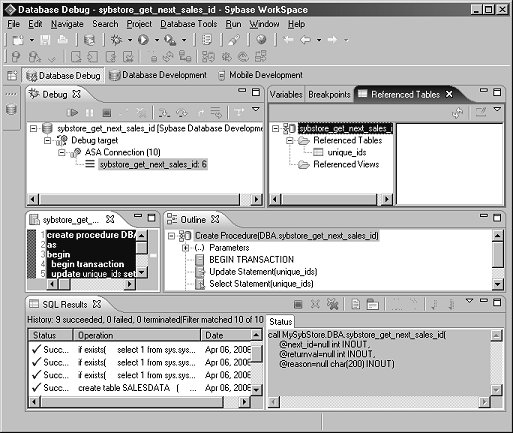
Select the Breakpoints view (in the upper right) to display the current breakpoints.
Leave the current breakpoint the same.
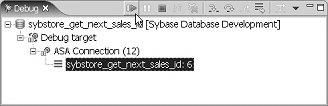
The Debug view toolbar contains tools for a variety of debug actions, including Resume and Terminate.
The Referenced Tables view, also in the upper right, displays the tables referenced by the executed SQL script.
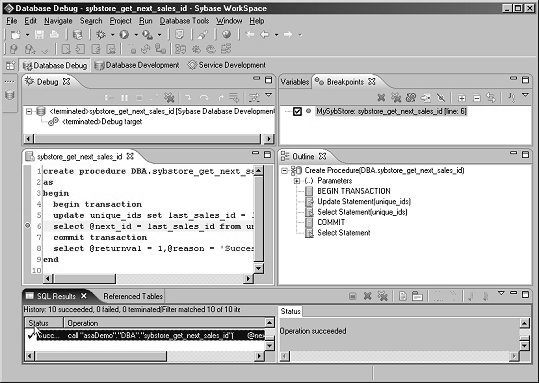
Click the Resume icon on the Debug toolbar.
Debug execution completes and the final results display.
Select Database Development from the perspective shortcut bar to return to that perspective.
You have now completed the tutorials for Database Development.
