

Chapter 26: Tracing and Profiling Applications
Profiling Routine View
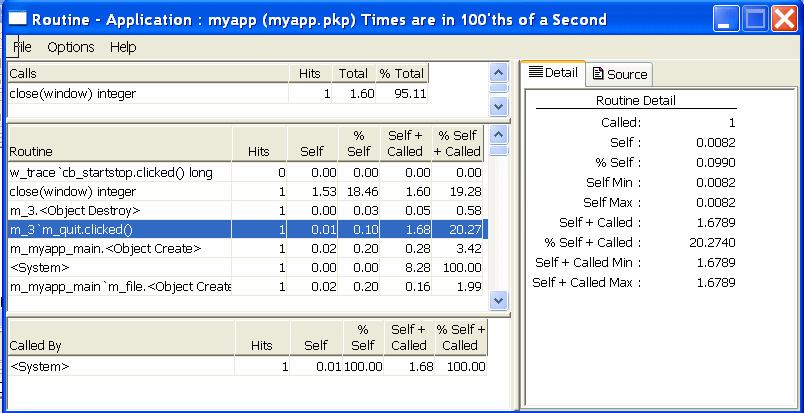
The Routine view displays statistics for a routine, its calling
routines, and its called routines. It uses multiple DataWindow objects
to display information for a routine:
Called routines The top DataWindow lists functions and events called by the
current routine.
Current routine The middle DataWindow and the DataWindow on the right highlight
the current routine and show detailed statistics.
Calling routines The bottom DataWindow lists functions and events that call
the routine displayed in the middle DataWindow.
The Routine view has two tabs:
The Routine view uses the call graph model to show the call
chain and cumulative statistics for routines and called routines.
Figure 26-2: Profiling Routine View
You can specify the current routine by clicking in the various
DataWindows.
Table 26-5: Specifying the current routine in
the Profiling Routine View
To do this
|
Click here
|
|---|
Establish a new current routine in the
current routine DataWindow
|
On the routine. The profiling tool updates
the top and bottom DataWindows with information on called and calling
routines.
|
Select a calling routine as the new routine
|
On the routine in the top DataWindow.
The profiling tool makes it the current routine in the middle DataWindow.
|
Select a called routine as the new routine
|
On the routine in the bottom DataWindow.
The profiling tool makes it the current routine in the middle DataWindow.
|
You can sort items by clicking the column headings.
Routine view metrics
The Routine view displays nine metrics. The profiling tool
accesses these metrics from instances of the ProfileCall and ProfileRoutine
objects. The time scale you specified in the Preferences dialog
box determines how times are displayed.
Table 26-6: Metrics in the Profiling Routine View
Metric
|
What it means
|
|---|
Hits (Called on Detail tab)
|
The number of times a routine executed
in a particular context.
|
Self
|
The time spent in the routine or line
itself. If the routine or line was executed more than once, this
is the total time spent in the routine or line itself; it does not
include time spent in routines called by this routine.
|
%Self
|
Self as a percentage of the total time
the calling routine was active.
|
Self Min
|
The shortest time spent in the routine
or line itself. If the routine or line was executed only once, this
is the same as AbsoluteSelfTime.
|
Self Max
|
The longest time spent in the routine
or line itself. If the routine or line was executed only once, this
is the same as AbsoluteSelfTime.
|
Self+Called
|
The time spent in the routine or line
and in routines or lines called from the routine or line. If the
routine or line was executed more than once, this is the total time
spent in the routine or line and in called routines or lines.
|
%Self+Called
|
Self+Called as a percentage
of the total time that tracing was enabled.
|
Self+Called Min
|
The shortest time spent in the routine
or line and in called routines or lines. If the routine or line
was executed only once, this is the same as AbsoluteTotalTime.
|
Self+Called Max
|
The longest time spent in the routine
or line and in called routines or lines. If the routine or line
was executed only once, this is the same as AbsoluteTotalTime.
|
|
Copyright © 2005. Sybase Inc. All rights reserved.
|
|
View this book as PDF 