Tracing code for 4GL JSP pages helps troubleshoot server processing problems you might encounter as you develop your pages. With tracing enabled, you can view details about the processing of your page, including all the server-side events that are triggered. Trace messages appear at the top of your page.
![]() Disable for production pages
Be sure to disable tracing when you deploy your Web target
to a production environment, so that your production pages do not
display the messages.
Disable for production pages
Be sure to disable tracing when you deploy your Web target
to a production environment, so that your production pages do not
display the messages.
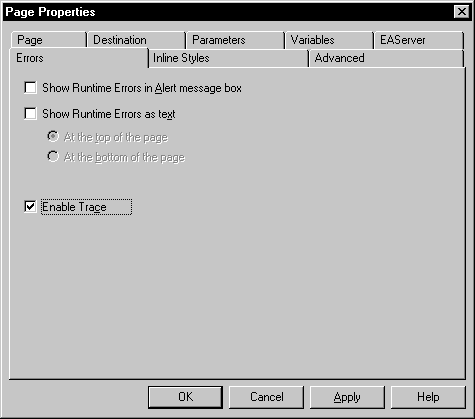
You enable trace messages on the Errors page of the Page Properties dialog box.
![]() To enable tracing:
To enable tracing:
Right-click on a 4GL JSP page open in the HTML editor, then select Page Properties from the pop-up menu.
Click the Errors page.
On the Errors tab page, select Enable Trace.

You customize tracing by writing scripts that call methods on psPage. These methods add a message to the trace and control the appearance of the text. The psPage object provides the following methods:
IsTrace (JSP targets only)
SetTrace
Trace
TraceIndent
TraceOutdent
For details about these methods, see the online Web and JSP Target Reference.