The debugger provides three different ways to examine the values of variables: TipWatch, QuickWatch, and the Variables view.
TipWatch is a quick way to get the current value of a variable of a simple datatype. When execution stops at a breakpoint, you can place the edit cursor over a variable in the Source view to display a pop-up tip window that shows the current value of that variable. You can also select a simple expression to display its current value.
TipWatch has some limitations: if the variable you select
is an object type, the tip window shows only an internal identifier.
For array types, it shows {...} to
indicate that more information is available. To show complete information for
object type and array type variables, use QuickWatch instead.
TipWatch does not evaluate function, assignment, or variable value modification expressions. If TipWatch cannot parse the string you select, the pop-up window does not display.
![]() Remote debugging
When you are debugging a remote component, Tip Watch does
not evaluate expressions or indirect variables.
Remote debugging
When you are debugging a remote component, Tip Watch does
not evaluate expressions or indirect variables.
QuickWatch provides the current value of simple variables and detailed information about object variables, including the values of all fields in the variable. QuickWatch can also evaluate function expressions, and you can use it to change the values of variables, evaluate expressions, and add variables and expressions to the Watch view.
![]() Exercise caution when evaluating expressions
QuickWatch evaluates all kinds of expressions, including functions,
in local debugging. If you select a function and activate QuickWatch,
the function is executed. This may have unexpected results. For
example, if you select
Exercise caution when evaluating expressions
QuickWatch evaluates all kinds of expressions, including functions,
in local debugging. If you select a function and activate QuickWatch,
the function is executed. This may have unexpected results. For
example, if you select dw_1.print() and
activate QuickWatch, the DataWindow is printed.
![]() To open the QuickWatch dialog box:
To open the QuickWatch dialog box:
When execution stops at a breakpoint, move the edit cursor to a variable or select an expression in the Source view, and do one of the following:
Select QuickWatch from the Debug or pop-up menu
Press Shift+F9
![]() To change the value of a variable from the QuickWatch
dialog box:
To change the value of a variable from the QuickWatch
dialog box:
Select an item in the tree view and do one of the following:
Click Change Value
Double-click the tree view item
In the Modify Variable dialog box, type a new value for the variable in the New Value box, or select the Null check box to set the value of the variable to null, and click OK.
Close the QuickWatch dialog box and continue debugging the application with the variable set to the new value.
![]() To evaluate an expression in the QuickWatch dialog
box and add it to the Watch view:
To evaluate an expression in the QuickWatch dialog
box and add it to the Watch view:
Change the variable or expression in the Expression box.
Click Reevaluate to display the new value in the tree view.
(Optional) Click Add Watch to add the expression to the Watch view.
![]() Remote debugging
When you are debugging a remote component, expressions and
indirect variables are not evaluated, and you cannot modify variable
values.
Remote debugging
When you are debugging a remote component, expressions and
indirect variables are not evaluated, and you cannot modify variable
values.
Each Variables view shows one or more types of variables in an expandable outline. Double-click the variable names or click on the plus and minus signs next to them to expand and contract the hierarchy. If you open a new Variables view, it shows all variable types.
Variable type |
What the Variables view shows |
|---|---|
Local |
Values of variables that are local to the current script or function |
Global |
Values of all global variables defined for the application and properties of all objects (such as windows) that are open |
Instance |
Properties of the current object instance (the object to which the current script belongs) and values of instance variables defined for the current object |
Parent |
Properties of the parent of the current instance |
Shared |
Objects, such as application, window, and menu objects, that have been opened and the shared variables associated with them |
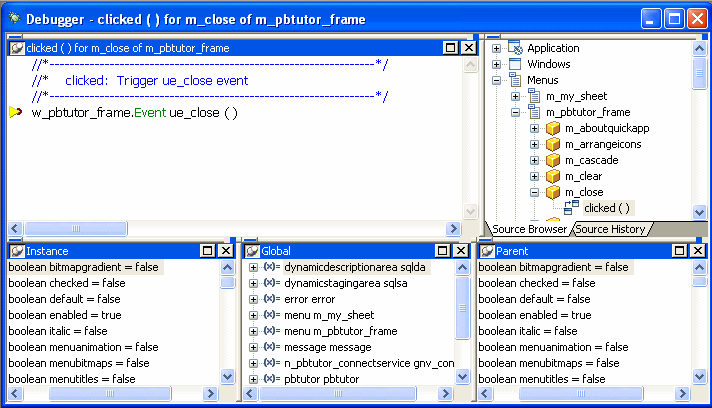
In the following illustration, an application has stopped at a breakpoint in the script for the Clicked event for the Close menu item on a frame's File menu. The Instance Variables view shows the properties of the current instance of the Close menu item. The Parent Variables view shows the properties of its parent, an instance of the File menu. Navigating through the hierarchy in the Global Variables view shows the same objects.
