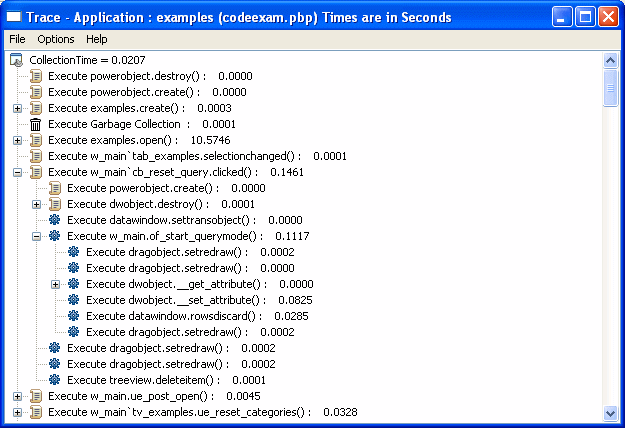
The Trace view uses a TreeView control to display the events and functions in the trace file. The initial display shows top-level routines. Each node expands to show the sequence of routine execution. The fully expanded TreeView shows the complete sequence of executed instructions for the trace file.
The Trace view uses the trace tree model to show the sequence of execution. It includes statistics and (for those routines that originated in PowerScript source) source code.You can use the Trace View Options section of the Preferences dialog box to control the display:
System routines This option controls whether the Trace view includes information for lines that execute PowerBuilder system routines.
Line information This option controls whether the Trace view includes line numbers.
The following screen shows a Trace view with several nodes expanded. The number to the right of each item is the execution time for that item.

The Trace view displays two metrics. The profiling tool accesses these metrics from instances of the TraceTree and TraceTreeNode objects.
Entry |
What it means |
|---|---|
Routine or line number |
The routine or line number that was executed. |
Execution time |
Total execution time for the Tree view entry. This is total time from the start of the entry to the end of the entry. For example, if you call the MessageBox function, this value reflects the elapsed time from when the message box was opened until the user provided some kind of response. |