![]()
![]()
![]()
![]()
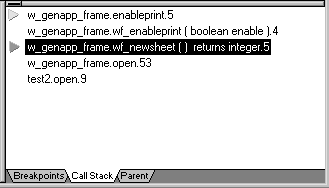
The Call Stack view shows the sequence of function calls leading up to the script or function that was executing at the time of the breakpoint. Each line in the Call Stack view displays the name of the script and the line number from which the call was made. The yellow arrow shows the script and line where execution was suspended.
You can examine the context of the application at any line in the call stack.
![]() To show a different context from the Call Stack
view:
To show a different context from the Call Stack
view:
Select a line in the Call Stack view.
Do one of the following:
Double-click the line
Select Set Context from the pop-up menu
Drag the line into the Source view
A green arrow indicates the script that you selected. The Source view shows the script and line number you selected, and the Variables and Watch views show the variables and expressions in scope in that context.